Key Application Metrics and Monitoring for Developers
You finally went live, congratulations! Now what?

You finally went live, congratulations! Now what?
Intro
In the past, code and infrastructure were handled by completely separate organizations. Developers wrote code, while IT set up servers. Developers fixed bugs, while IT handled infrastructure maintenance. However, with the trend towards DevOps and the increased availability of Platform-as-a-Service (PaaS), there is an increasing overlap between Dev and IT. For developers, this can mean taking care of infrastructure, a task that is quite different from standard app dev.
As a full-stack developer, I've been pushed to handle more and more infrastructure-related responsibilities, including monitoring production applications. We just went live for HP Foundation at https://www.life-global.org with our Next.js-based learning management system. As a dev team lead, I have been researching how to best support and maintain the application through metrics.
In this article, I will cover three basic metrics I think are important: response time, error rate, and slow transactions. These are particularly relevant for developers. For each metric, I'll explain what it is, why you should care, and how to monitor it in both Azure and Heroku. Finally, I'll also talk a bit about the benefits of being proactive in your monitoring.
But first—what exactly is a metric?
What is a Metric?
Per Investopedia, a metric is a “measure of quantitative assessment” commonly used for assessing, comparing, and tracking performance. From this definition, we can tease out a couple attributes of metrics. First, a metric is a statistical tool; second, metrics tell us about relative rather than absolute performance.
A Statistical Tool
Metrics are statistical tools. As such, the more we understand about statistics, the more we can properly interpret and leverage our metrics. Yes, that means we need to understand not only terms like mean, median, and range, but also distributions and percentages. For example, if the 95th percentile response time is 350ms, that means that 95% of all response times were less than or equal to 350ms.
For those interested in a deeper dive into statistics, Think Stats is available online for free and does a great job of introducing basic concepts for developers.
Relative Performance
As a developer, it can be all too easy to fall into the trap of absolutes. For example, consider when you perform a code review and think to yourself:
This is the wrong way to solve this problem.
Or perhaps you are debugging a bug in production, and you finally found the issue. You might think:
This code was wrong all along; if we had just thought about this case, we could have handled it from the start.
However, metrics are a statistical tool, and statistics generally do not give you information about things which are absolutely “right” or definitely “wrong”. Rather, metrics provide insight into understanding the current and past state of your application. By comparing the two you can understand the relative performance of the application. Instead of “good” or “bad”, we will learn about “better” or “worse”. Understanding this is critical to the proper use of metrics.
Now that we have a better understanding of metrics generally, let’s take a look at our three metrics.
The Three Metrics
The three metrics we'll look at are response time, error rate, and slow transactions. I have selected these metrics for several reasons. First, these three metrics are relevant across infrastructure setups. It does not matter whether you are using a serverless setup, managed application instances, Kubernetes swarm, or even hosting your application directly on actual hardware, these metrics still apply.
Second, these metrics tie directly into the user experience of your application. Users have ingrained expectations about the responsiveness and reliability of the applications that they interact with, and oftentimes do not report issues until it's too late. Proactive monitoring of these metrics can help to keep users loving your application ❤️.
With that, let’s get into the metrics! First, let’s take a look at response time.
Response Time

What is it?
Response time is the time it takes your application to respond to a request made by a client.
Why should I care?
This is a key indicator of the responsiveness of your application to user input or page switching. Long response times mean that the user is waiting longer for your application. They also are an indication of high server load, as the server needs to spend more time working for each request. Heroku recommends that the response time of your web application be under 500ms, which is a good rule of thumb.
How do I monitor this?
First, let’s clarify which statistics we should be looking at. You might lean towards looking at average response time, but this can be skewed by outliers such as super-long requests.
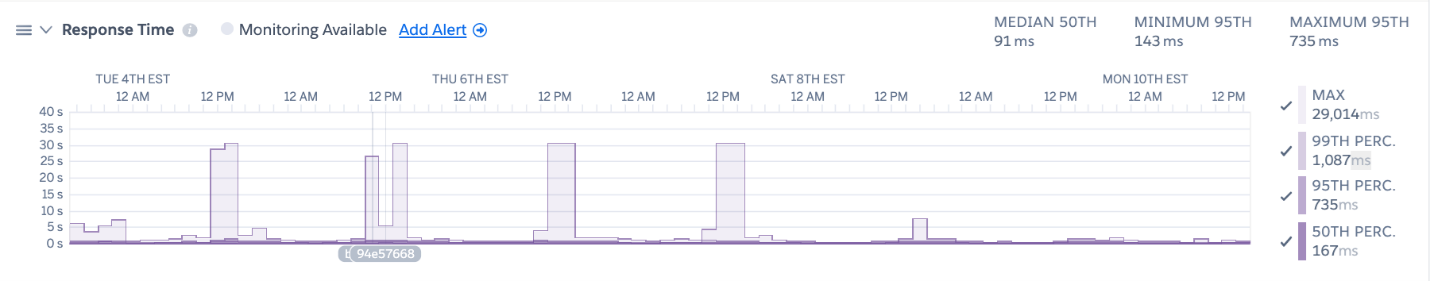
Instead, I recommend looking at percentile-based statistics on response time. The median, also known as the 50th percentile measurement is a useful metric as it lets us know that half of all requests take that amount of time or less. The 95th and 99th percentile measurements are also useful as they tell you how most users experience your application as a whole. The Heroku Dashboard provides a nice set of visualizations that show these three key stats:
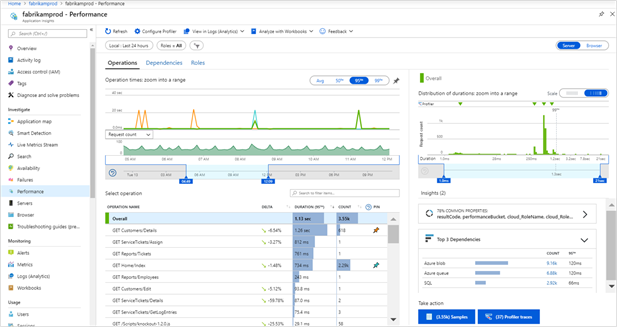
Similarly, Azure has server response time metrics available under their Application Insights module:
Error Rate
Next, let’s take a look at error rate.

What is it?
Error rate is simply the number of errors generated by the application over a certain period of time.
Why should I care?
As developers, we’re accustomed to looking into bugs, which are reproducible deviations from a set of specified requirements. However, in a real-world application environment, sometimes errors happen due to network and infrastructure variables that are external to our application code. As such, it’s important to look not only into the individual errors but also the overall rate of errors as an indicator of application stability.
How do I monitor this?
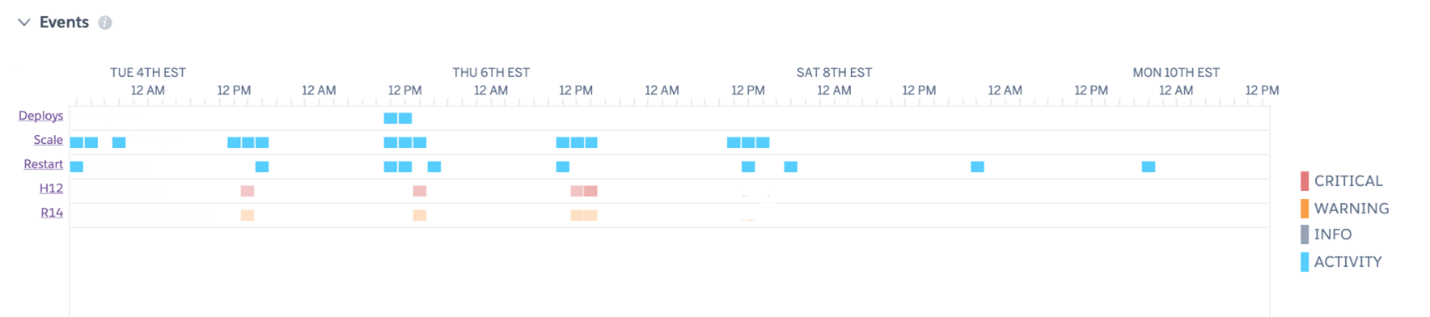
Error rate monitoring is more of an art than a science, as it depends heavily on the types of errors. You can get started by looking at the Events section in Heroku’s Metrics tab. Hovering over each of the squares gives you details about that individual event.
For Azure, you can go to the Application Insights Failures panel:
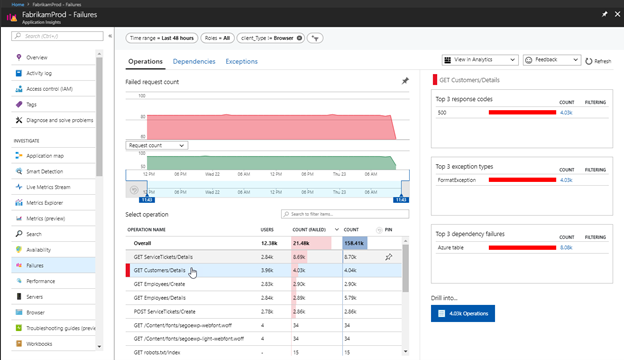
From there, make a note of both the error frequency per unit of time as well as the error frequency per request. The frequency per unit of time will give you a sense of how often errors occur for the application as a whole. Frequency per request focuses on the user experience and illuminates how often users encounter errors as a percentage of their overall usage of the application. Over time, tracking these two measurements of error rate will give you insight into how the health of your application is changing.
Again, it is difficult to give absolute numbers here—relative performance is what we are tracking. That said, if your application has service-level objectives or agreements then that may influence your target rate. The Google SRE Workbook gives an example of setting up an alert for a 99.9% SLO. If your application is pursuing that level of reliability, then your desired error rate would be < 0.1%. The key is to set a realistic, achievable goal.
Additionally, take a look at the top exception types and do some basic triage. If any critical errors or issues which would lead to data loss occur, make a note to investigate these before your next review. This is more akin to resolving a standard bug.
Slow Transactions
Finally, let’s explore slow transactions.

What are they?
Any transaction which takes a long amount of time. Naturally, “long” can be relative depending on the application and type of transaction.
Why should I care?
Sometimes, we can have requests which don’t happen frequently enough to skew the response rate, and they don’t error out completely. However, due to the length and compute power required, they still affect the responsiveness of the application. Slow transactions oftentimes reveal bottlenecks in performance which affect the user experience more than the frequency might indicate.
Additionally, long-running transactions can take up an inordinate amount of compute resources, which can negatively impact other transactions.
How do I monitor this?
Monitoring slow transactions isn't as straight-forward. There are two main ways we can get a list of slow transactions. The simplest is to sort the list of transactions by duration, and look at the length and frequency of our longest-running transactions. As we discussed under the response time section, I recommend singling out any transaction that takes over 500ms for the average web application.
A more involved way would be to look at the transactions with durations above your 95th percentile response times. Similarly, you could use any percentile you like. However, for the resource-constrained small dev team, I would not recommend lowering that percentile too much.
Either way, once you have a list of long-running transaction types, you can optionally sort them further by calculating the overall time taken by a given transaction type over a unit of time. For example, for a long-running SQL query which takes an average of 1.3 s to run, and has run 1,000 times over the last seven days, simply multiply 1.3*1000 = 1300s / week. Calculate this for each of your transaction types to get a sense of which transaction types to prioritize first. Typically, the one that requires the most time overall is likely to be the one you should work on first. However, other factors such as memory/CPU usage during those transactions may influence that as well.
This is the last of the three metrics we'll look at in this article. Before I conclude, however, a quick note on how we should and should not monitor:
Proactive Monitoring versus Reactive Fire-Fighting

As a developer, it's all too easy to fall into the habit of what I call reactive firefighting, or responding only or primarily to reported issues or bugs. These issues are easy to prioritize, as it is clear that a user is already experiencing an issue or downtime. However, while you are busy fighting the fire, the fire is continuing to damage application downtime or cause some other issue.
Proactive monitoring is the best way to reduce the number of fires that start in the first place. In essence, you need to monitor your metrics on a regular basis. This is proactive because it requires you or your team to look at your application response time, error rate, and slow transactions before users report any issues. By reviewing your metrics on a regular basis, you can identify issues before users report them, and you can proactively address errors or bottlenecks that could become larger problems.
Additionally, monitoring your metrics regularly will give you a sense of what is “normal” and what is abnormal for your application. As mentioned earlier, metrics are the most helpful in illuminating relative rather than absolute performance. Heroku recommends creating a review document each time you look at your metrics. Forming this habit will allow you to track how your application performs over time.
Summary
In this article, I have laid out three basic metrics to get you started on your application monitoring journey! However, response time, error rate, and slow transactions are just the beginning. For a more detailed overview of application performance monitoring, I recommend Heroku’s guide.
For those who are ready to dive into the world of Site Reliability Engineering, Google’s page and book are hard to beat, and free! That said, this is a field which can feel quite alien for the average app developer, so I recommend monitoring something small rather than nothing at all.
If you have any questions or comments, my contact info is in the footer. Thanks for reading!